


Case Study
Case Study
The application of optiSLang supports CAE-processes of cost and function optimization to create, compare and evaluate different competitive design variants of solenoids used for the control of automatic transmissions.
Introduction Dilemma of the Product Development Cost as well as function of a product are decisively influenced by its requirements, customer benefits and, especially, by its design. There are different development approaches to reduce the cost and to optimize the function of products, which differ in scope, potential of influence and required time for either new development or an extension of a new variant or a ratio project.
In addition to a reduction of the product costs, these approaches also lead to a launch of new products and technical innovations in shorter time, with the goals of high quality and attractive prices. The greatest potential for influencing costs and functions is in the time of product planning and development at the beginning of a product realization like shown in Figure 1. The design, development and production planning departments influence cost and function of a product with approximately 90 % by a simultaneous cost share of about 9 % as given in Ehrlenspiel et. al. (2014). Due to these facts, a very close networking of technical-scientific and cost accounting aspects in these three departments is necessary.
The challenge in designing products is to seek an optimal combination of function and cost fulfillment without the knowledge where to search exactly. One reason for this dilemma can be different and contradictory needs of customers and the number of possible solutions. In order to determine the cost and functional optimum, several component topologies with different materials, manufacturing processes, geometric parameters and tolerances would have to be developed, designed and compared to each other.
Even a simple comparison of different screw connections, which can be interpreted as different product topologies, shows the complexity cost correlation only in terms of different relative costs.
Performing such a detailed study as shown in Figure 2 for all components of a product will require a large number of samples, development time and costs. No company can afford such an effort due to the cost and time pressure referred by Reischl (2000). In practice, therefore only a few detailed so-lutions are compared for example on the basis of a morphological box and a subsequent pairwise comparison or similar development methods. The resulting product costs are either estimated using different methods or calculated with the appropriate effort as mentioned e.g. in Pahlet. al. (2007).
This detailed problem description clearly shows the complexity and comprehensiveness of a cost and function optimization. It also becomes obvious that there is a great potential in creating such a methodology. Here, the basic focus is to produce a variety of variants with different component topologies in a short time for the analyses of their functions and costs. Finally, this evaluation enables a faster development of competitive and innovative products. The actual state of the art is a purely functional optimization based on a parameterized product model and a defined workflow as shown in Figure 3. Computer-aided optimization software, e.g. Ansys optiSLang, was used as shown in Schwarz (2018). New design variants are generated by using an evolutionary algorithm, which varies geometrical parameters like diameter and length measures within specified limits. Here, the functional characteristics are determined by simulation and are evaluated in accordance with the target values and constraints for each design. Due to the optimization logic, which is contained in the algorithm and the objective functions, a so-called Pareto diagram is created as it can be seen in the middle of Figure 3 for two technical objectives.
Part of the presented research work is to determine the cost for each generated design and to declare and optimize this value as a target. In this article, such an extension is described for the first time. Consequently, the potential solution space is extended by an economical dimension as shown on the right side of Figure 3.
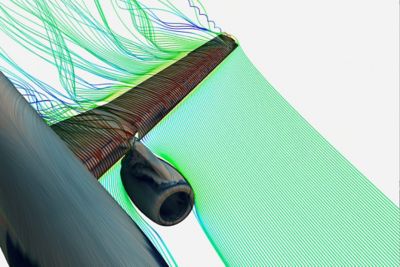
The method is developed by using the example of a proportional solenoid, as depicted in Figure 4. This sole-noid is used to control automatic transmissions. Usually, such a solenoid is operated at a maximum of 1,2 A and generates a magnetic force of up to 25 N. The customer specifies the characteristic curve of the magnetic force stroke for different current levels as shown in Figure 4. Typical customer specifications are particular forces and slope gradients at given stroke positions. For the solenoid used in this investigation, a function optimization like illustrated in Figure 3 (see previous page) has already been available. Due to the large number of pieces, the product is very well suited for an extension of the function optimization to a cost and function optimization
엔지니어링 과제에 직면하고 있다면우리 팀이 도와드리겠습니다. 풍부한 경험과 혁신에 대한 헌신을 가지고 있는 우리에게 연락해 주십시오. 협력을 통해 엔지니어링 문제를 성장과 성공의 기회로 바꾸십시오. 지금 문의하기