-
United States -
United Kingdom -
India -
France -
Deutschland -
Italia -
日本 -
대한민국 -
中国 -
台灣
-
Ansys stellt Studierenden auf dem Weg zum Erfolg die Simulationssoftware kostenlos zur Verfügung.
-
Ansys stellt Studierenden auf dem Weg zum Erfolg die Simulationssoftware kostenlos zur Verfügung.
-
Ansys stellt Studierenden auf dem Weg zum Erfolg die Simulationssoftware kostenlos zur Verfügung.
-
Kontakt -
Karriere -
Studierende und Akademiker*innen -
Für die Vereinigten Staaten und Kanada
+1 844,462 6797
ANSYS BLOG
April 5, 2022
How A-weighting Reflects What We Hear
If you hear a tree fall in the forest, you’re only hearing part of it. That’s because the human ear isn’t evenly sensitive to all frequencies, making the sound we perceive different than the actual noise. To compensate for this discrepancy in sound measurements, engineers rely on an adjustment called A-weighting.
What is A-weighting?
A-weighting is an adjustment applied to sound measurement to reflect how a noise is perceived by the human ear. This weighting depends on the frequency and can be applied throughout the audible spectrum to quantify the natural human hearing response. It’s the most common type of weighting system used to analyze noise measurements.
The human ear can perceive sound over a very large range of values, but our auditory system has limited sensitivity to lower and higher frequencies. The interference caused by our torso, head, and outer and inner ear means we receive sound very differently than a body-less microphone. A-weighting accounts for this difference by cutting off the frequencies that the average person cannot hear, creating a more accurate assessment of how a sound will be received.
Non-weighted noise measurement is described in decibels (dB), and A-weighted noise measurement is described as a dBA or dB(A). Because the A-weighted measurement represents more of what you actually hear, two sounds can have the same dB level, but different dBA levels. For example, if one sound is 1000 Hz and one is 100 Hz, the 1000 Hz sound will be perceived louder because our ears are not as equipped to process the lower frequency tone.
Example of a 1000 Hz sound
Example of a 100 Hz sound
The A-weighting Curve
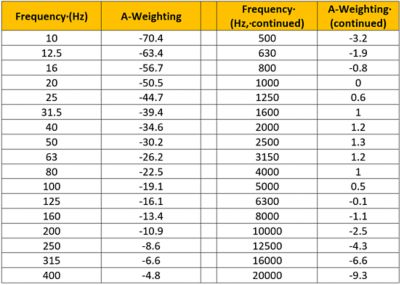
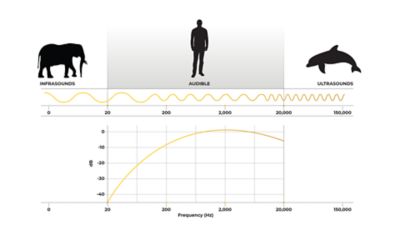
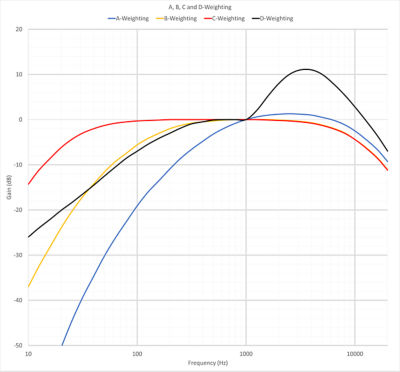
The A-weighting curve was established after Fletcher-Munson’s equal loudness contours, to match the ear sensitivity at each frequency. It decreases as the frequency approaches 20 Hz, because our hearing weakens in this range of frequencies.
How is A-weighting Used for Sound Measurement?
Because A-weighting readings reflect the sensitivity of the human ear, they are commonly used to assess potential hearing damage caused by loud noises (such as aircraft or trains) and are used globally to evaluate environmental hearing damage risks.
In engineering, A-weighting sound measurements are applied to ensure that sound is received at levels within the desired range. Meeting legislative requirements and increasing customer comfort are primary goals of measuring sound with a weighting for human response. Thus, the dB(A) scale is largely used in R&D departments for internal specifications and for regulation across industries, including automotive, aerospace, railway, consumer goods, environment, and building.
For instance, to get approval certificates, the EU requires that the pass-by noise of vehicles does not exceed sound levels for specific operating conditions and microphone positions, depending on the vehicle type. These values are often expressed in dB(A).
Other Types of Frequency Weighting Curves
The A-weighting curve is the most common weighted sound curve. It is considered the standard for general purpose measurement. Although they are less used in engineering, other frequency weighting curves can be applied for specific needs, generally for higher sound levels.
- B-weighting matches the 70-phon equal-loudness contour, which corresponds to moderately loud sounds. It may be used for measuring the interior noise of vehicles.
- C-weighting matches the 100-phon equal-loudness contour, which corresponds to very loud sounds. Because of its flatter shape, C-weighting is mainly seen on sound level meters to measure broadband noise.
- D-weighting is specifically used for aircraft noise measurements.
- G-weighting is specifically used for measurements in the infrasound range.
How Does A-weighting Help with Simulation?
Converting acoustic simulated data into A-weighted levels helps engineers compare different designs and make more accurate decisions based on values that are closer to the human perception of the sound intensity. Ansys Sound enables you to listen to analyze and design sound sources based on real recordings and acoustic simulations.
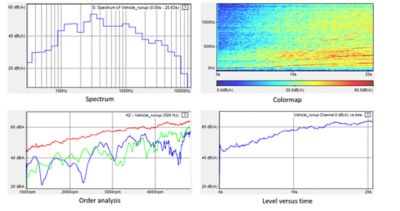
The dB(A) unit can be used in many windows.
Innovative time-frequency analysis and processing functions are available for isolating and modifying various sound components, and to assess the influence of sounds on human perception. Ansys Sound can also reproduce the 3D sound in-simulator and in-vehicle, including tools to tune Active Sound for ICE or EVs.
To learn how to improve the accuracy of your sound measurements, view the webinar: Ansys 2022 R1 Ansys Sound Update.


